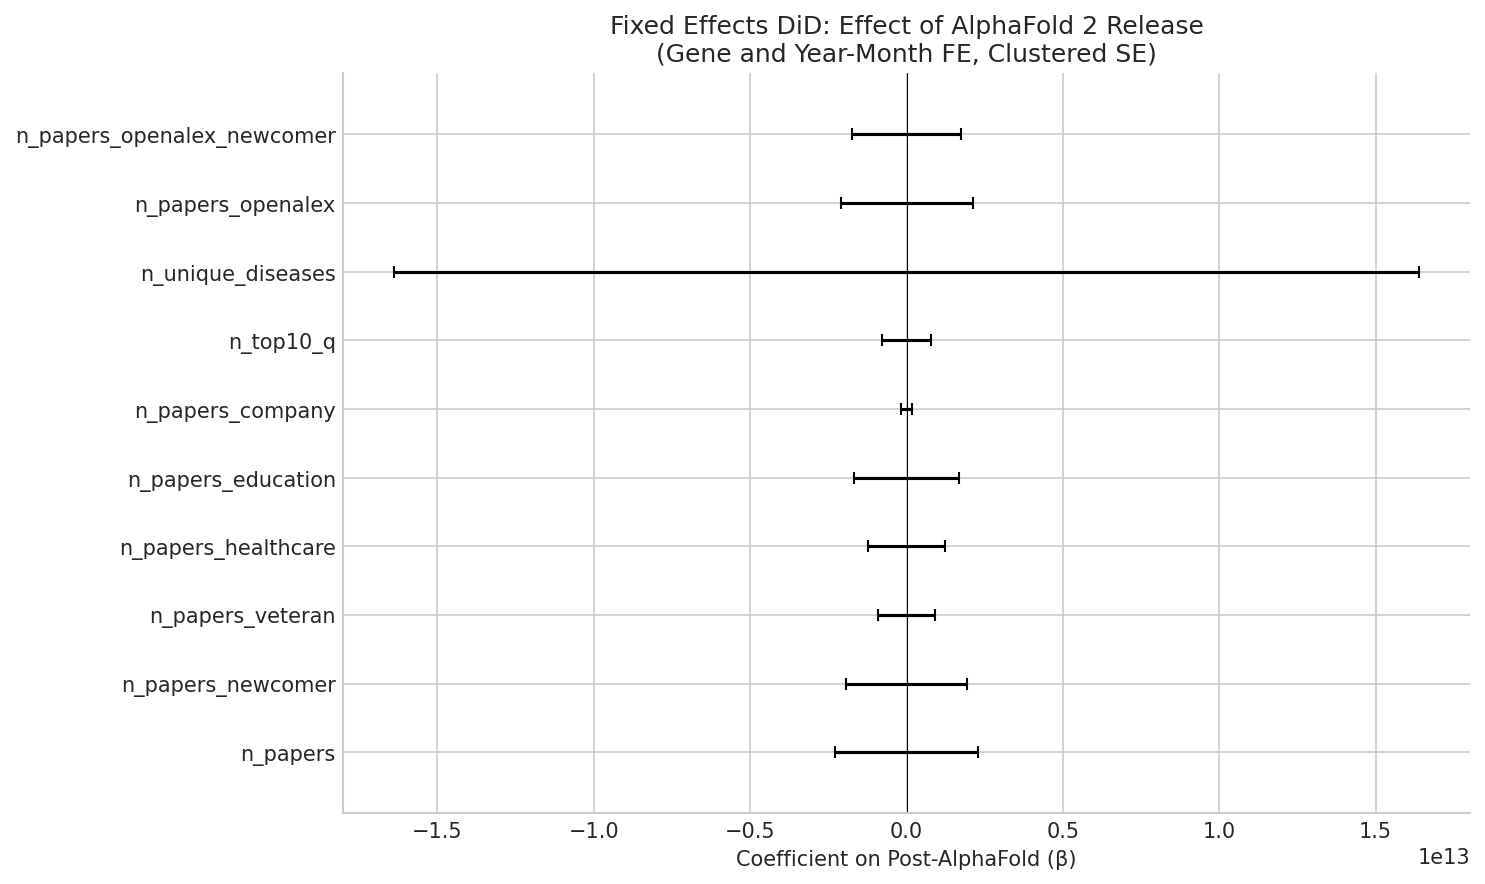
Treatment: AlphaFold 2 public release (July 2021)
Panel: Gene-month level, Jan 2020 - Dec 2023
| Outcome | β (Post) | SE | 95% CI | N | R² (within) |
|---|---|---|---|---|---|
| n_papers | 2.0620 | (1172948480069.1499) | [-2298979020933.472, 2298979020937.596] | 949,824 | 0.0016 |
| n_papers_newcomer | 1.3965 | (989998539874.2324) | [-1940397138152.099, 1940397138154.892] | 949,824 | 0.0007 |
| n_papers_veteran | 0.7021 | (468392797057.0117) | [-918049882231.041, 918049882232.445] | 949,824 | 0.0019 |
| n_papers_healthcare | 0.9580 | (624428699138.7983) | [-1223880250311.087, 1223880250313.003] | 949,824 | 0.0038 |
| n_papers_education | 1.0790 | (850644814431.4664) | [-1667263836284.595, 1667263836286.753] | 949,824 | 0.0003 |
| n_papers_company | 0.0326 | (90049604062.4330) | [-176497223962.336, 176497223962.401] | 949,824 | -0.0009 |
| n_top10_q | 0.4925 | (396983730191.3441) | [-778088111174.542, 778088111175.527] | 949,824 | 0.0023 |
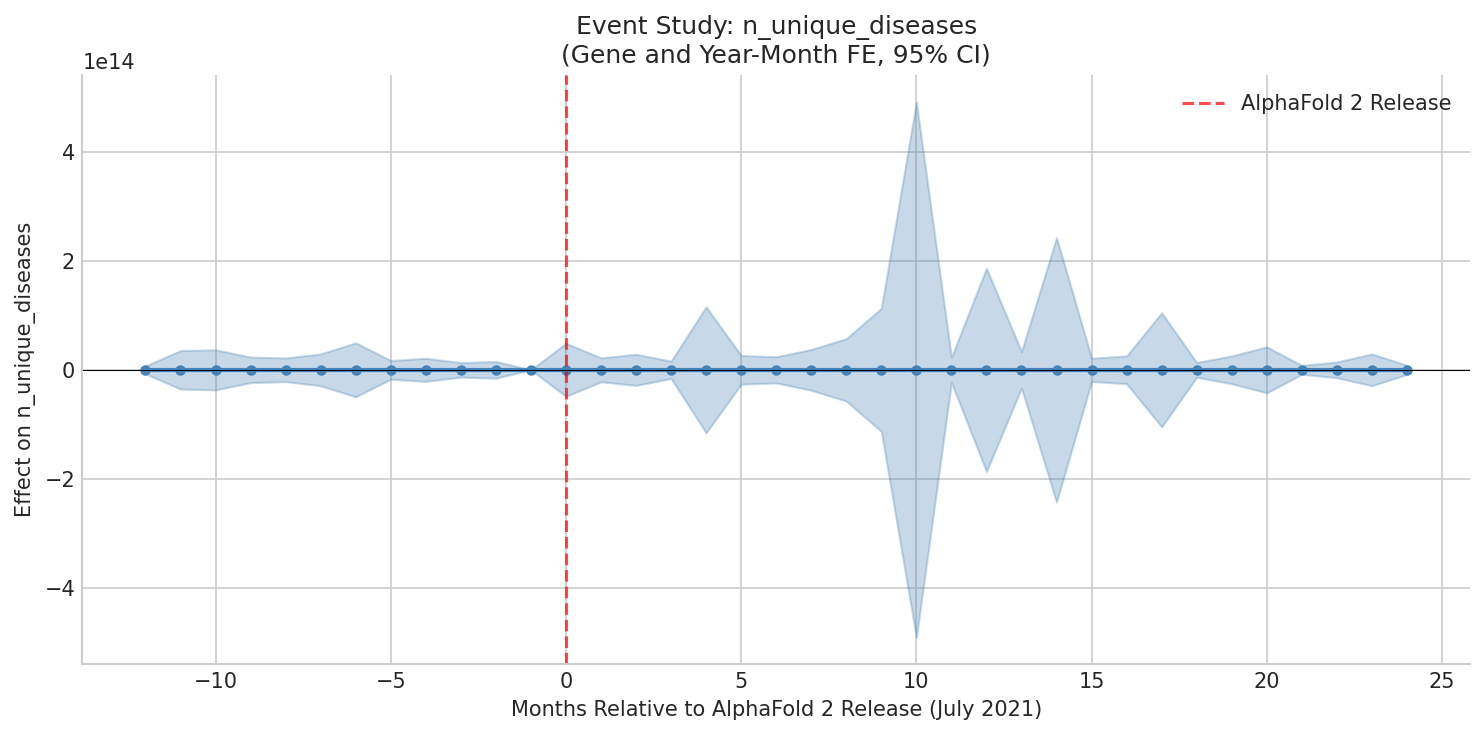
| n_unique_diseases | 12.3252 | (8355436477366.5693) | [-16376655495626.152, 16376655495650.801] | 949,824 | 0.0062 |
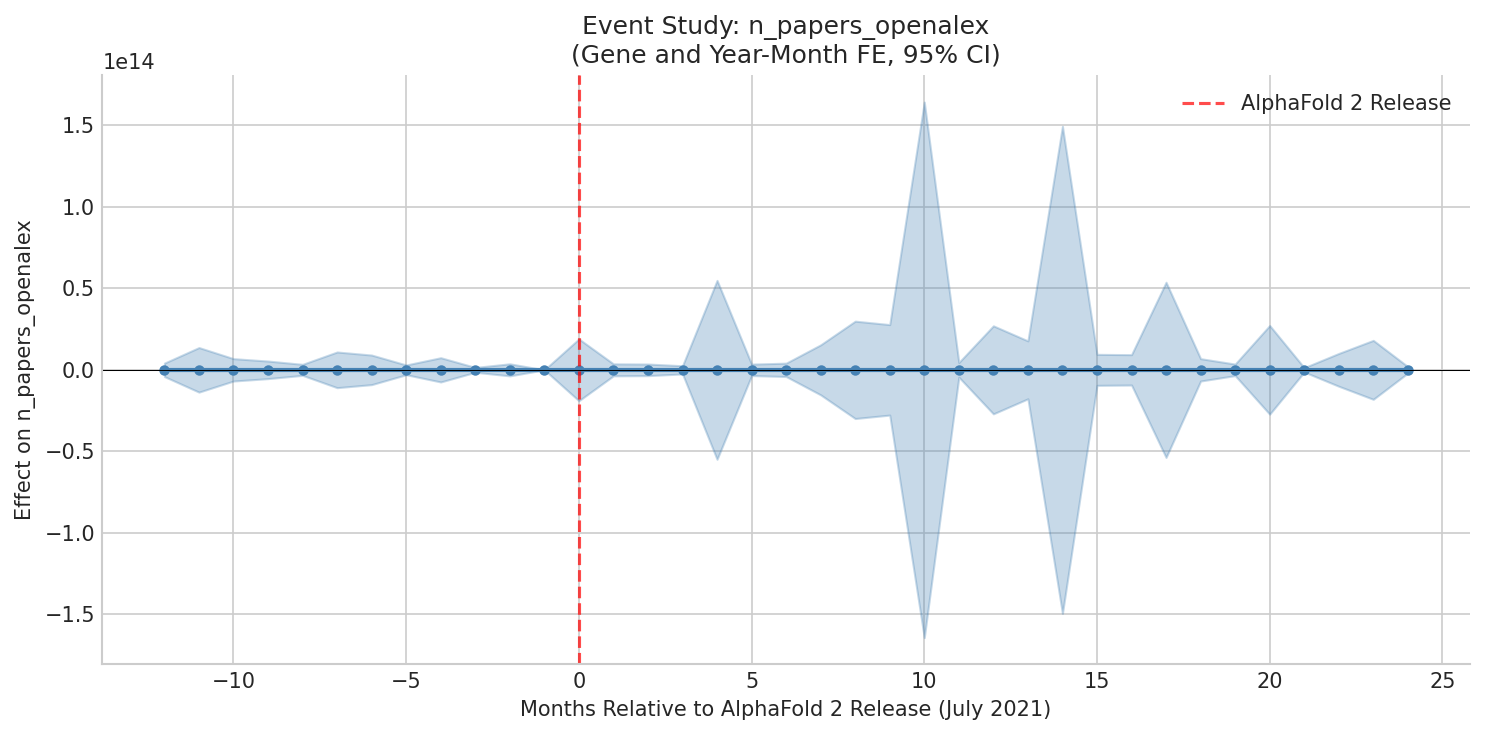
| n_papers_openalex | 3.6255 | (1076344105056.0890) | [-2109634445906.309, 2109634445913.560] | 949,824 | -0.0039 |
| n_papers_openalex_newcomer | 2.5010 | (892808087378.8148) | [-1749903851259.976, 1749903851264.978] | 949,824 | -0.0055 |
*** p<0.01, ** p<0.05, * p<0.1
Event study specification with leads and lags around the treatment date (t = -1 as reference):

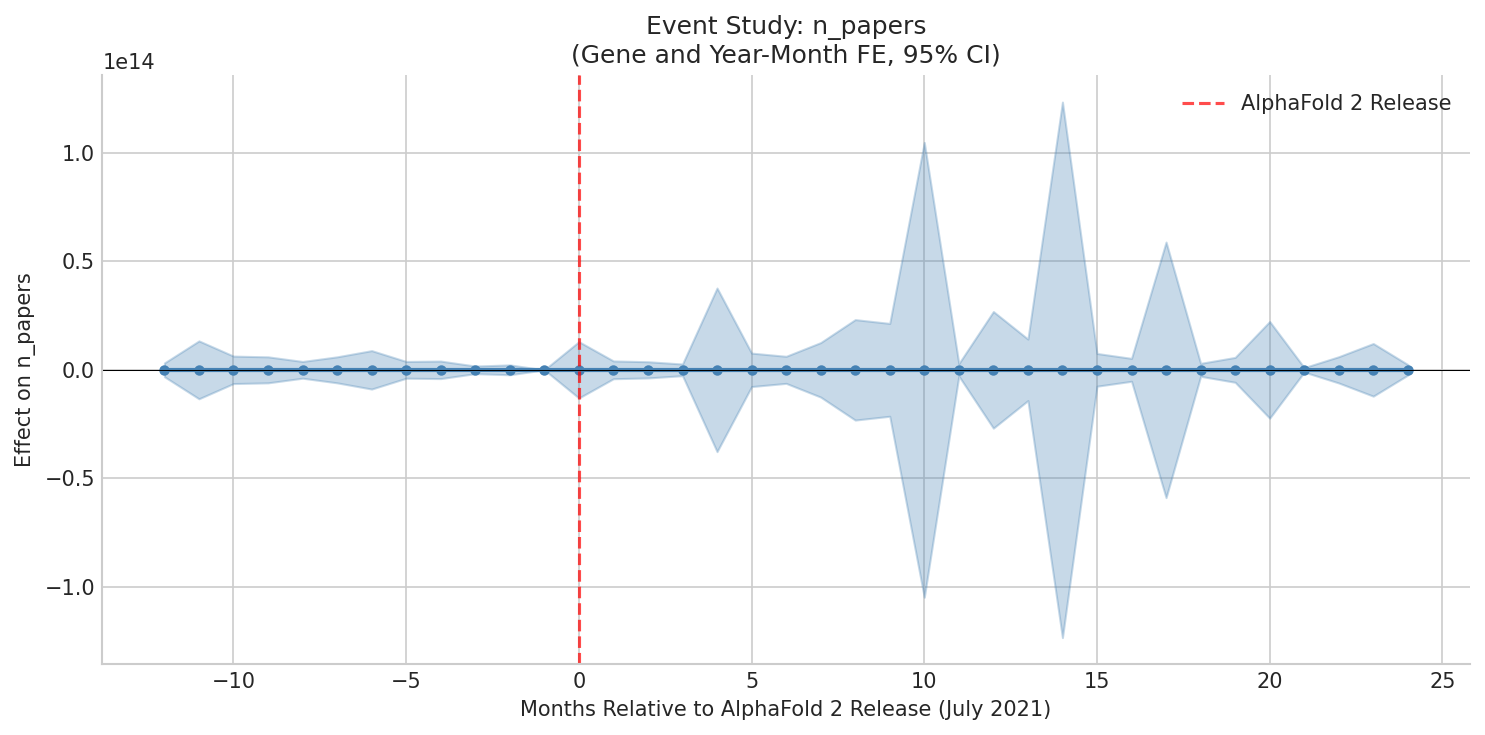

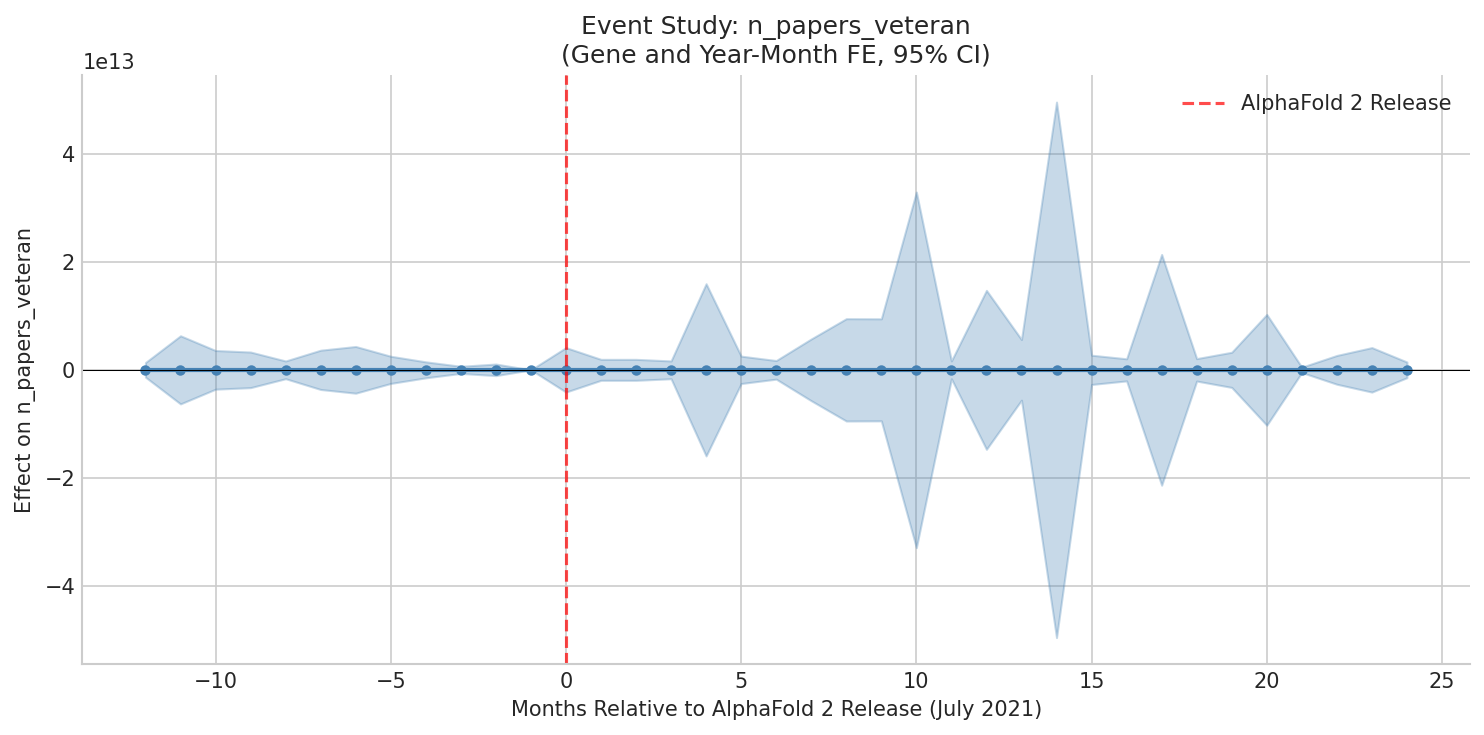
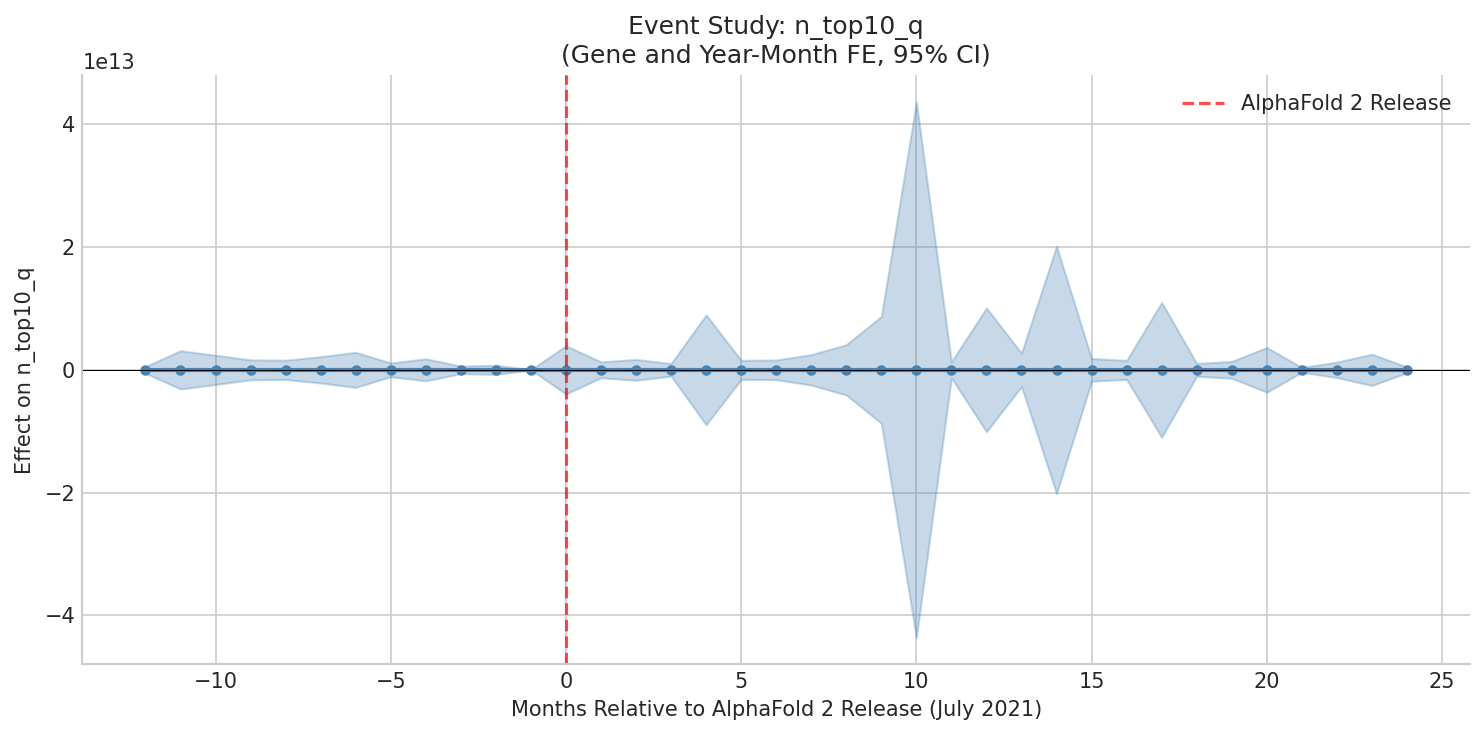
| Outcome | β | % Effect | p-value |
|---|---|---|---|
| log(n_papers+1) | 0.0474 | 4.9% | 1.0000 |
| log(n_papers_newcomer+1) | 0.0426 | 4.4% | 1.0000 |
| log(n_papers_openalex+1) | 0.1545 | 16.7% | 1.0000 |