Overview
The FDA Orange Book contains patents protecting FDA-approved drugs. This analysis compares Orange Book patents against all pharmaceutical patents in our GWAS spillover dataset to understand how approved drug patents differ from the broader patent landscape.
Key Statistics
- Orange Book patents: 6,411 unique patent IDs
- Matched in dataset: 1,405 patents (21.9%)
- Panel cells with OB patents: 511,713 (0.35% of 148M)
- Total OB patent count: 608,778
Analysis Results
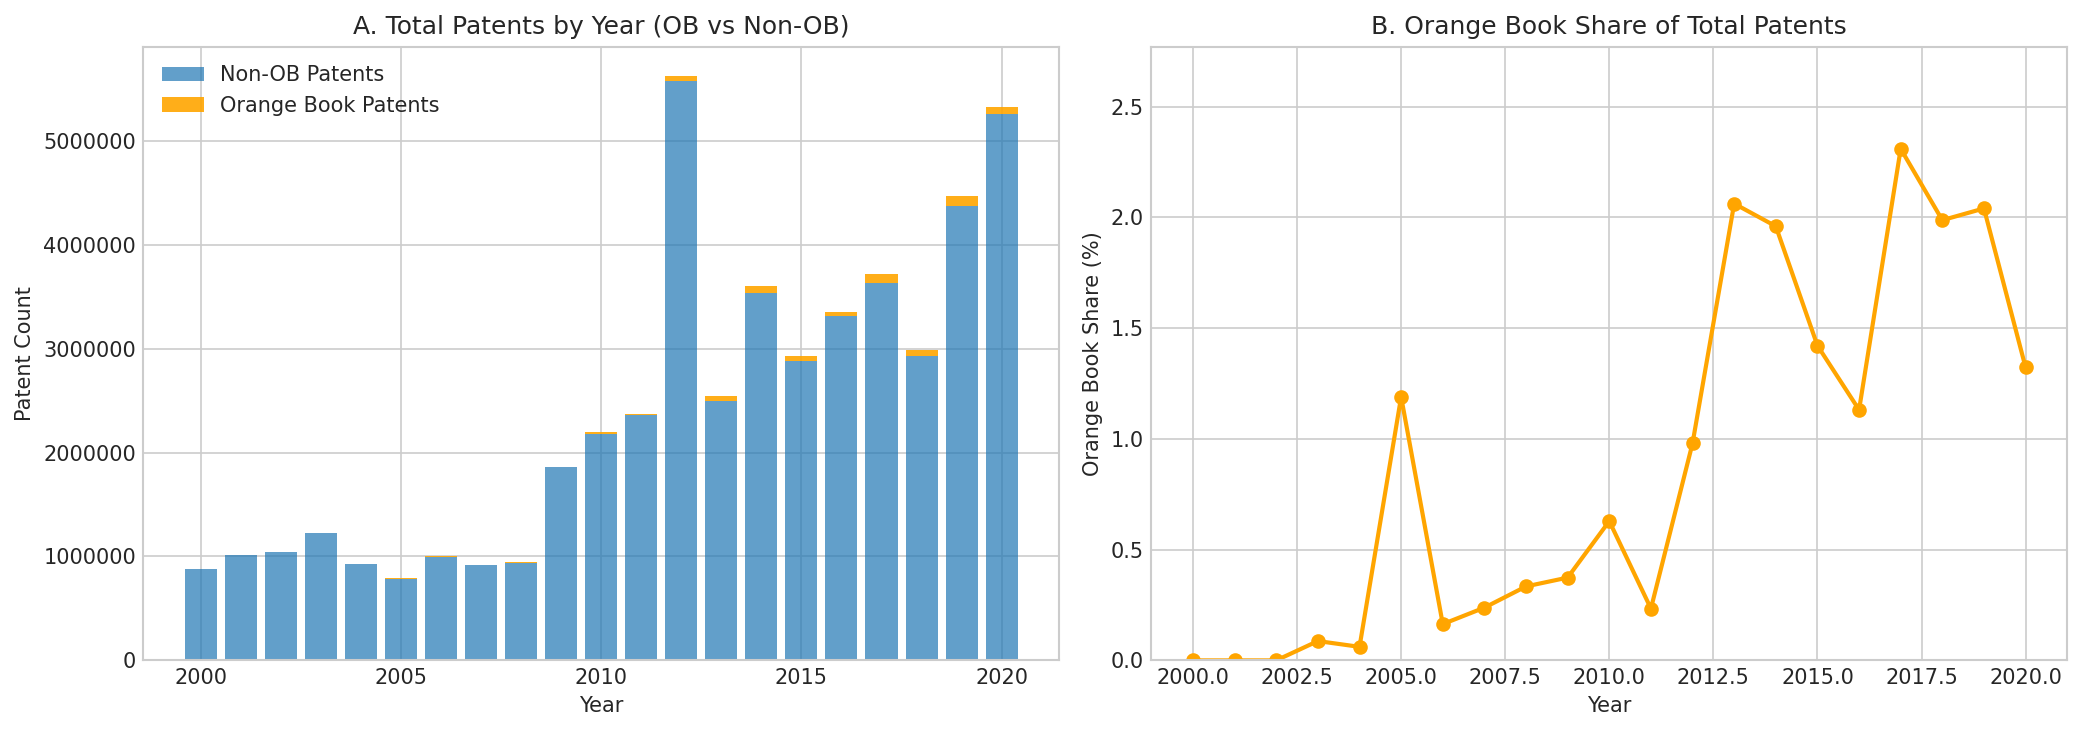
Figure 1: Total patents by year, split by Orange Book vs non-OB (left), and Orange Book share of total patents over time (right). OB share ranges from 0% in 2000-2002 to peaks of ~2.3% in 2017.
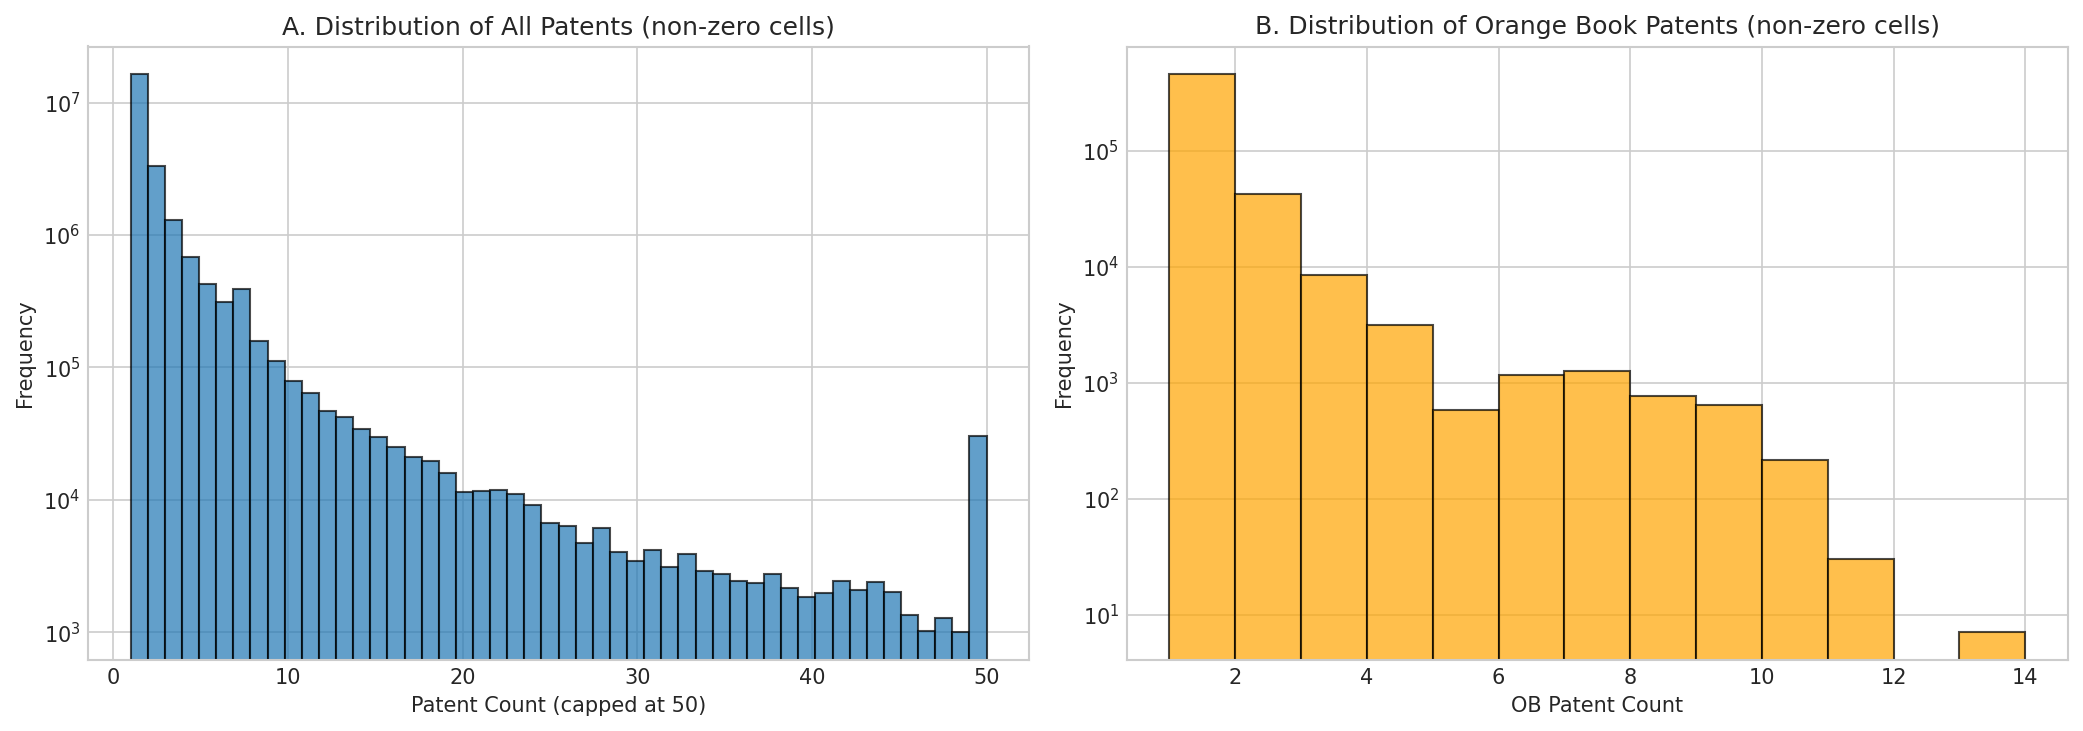
Figure 2: Distribution of patent counts per gene-disease-year cell. Left: all patents (capped at 50). Right: Orange Book patents only. Both show heavy right-skew typical of patent data.
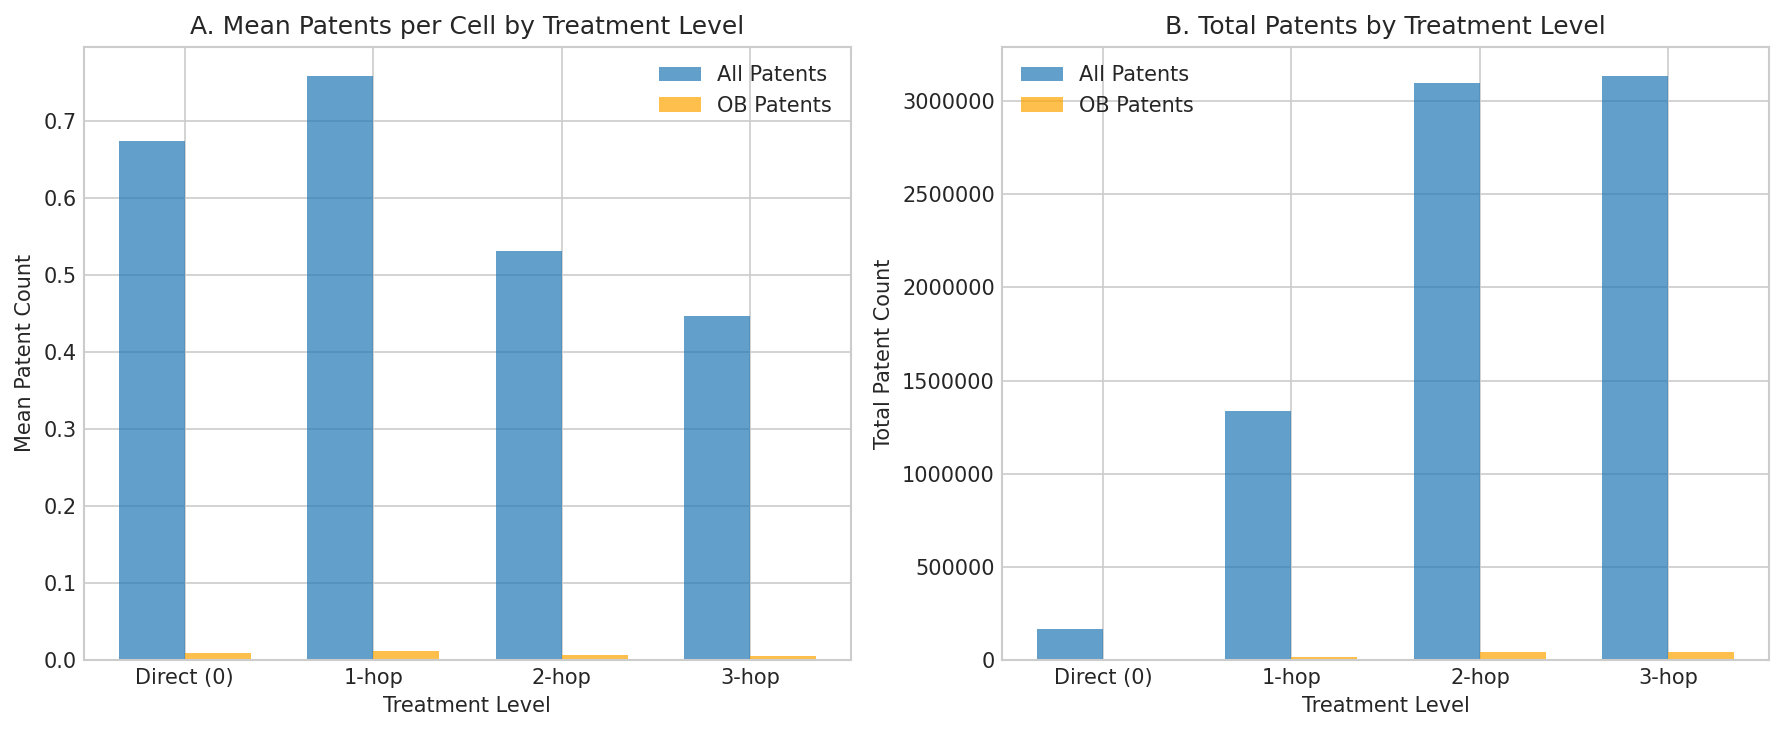
Figure 3: Mean and total patent counts by GWAS treatment level. Direct GWAS discoveries (Level 0) and 1-hop spillovers show slightly higher OB patent rates than 2-hop and 3-hop spillovers.
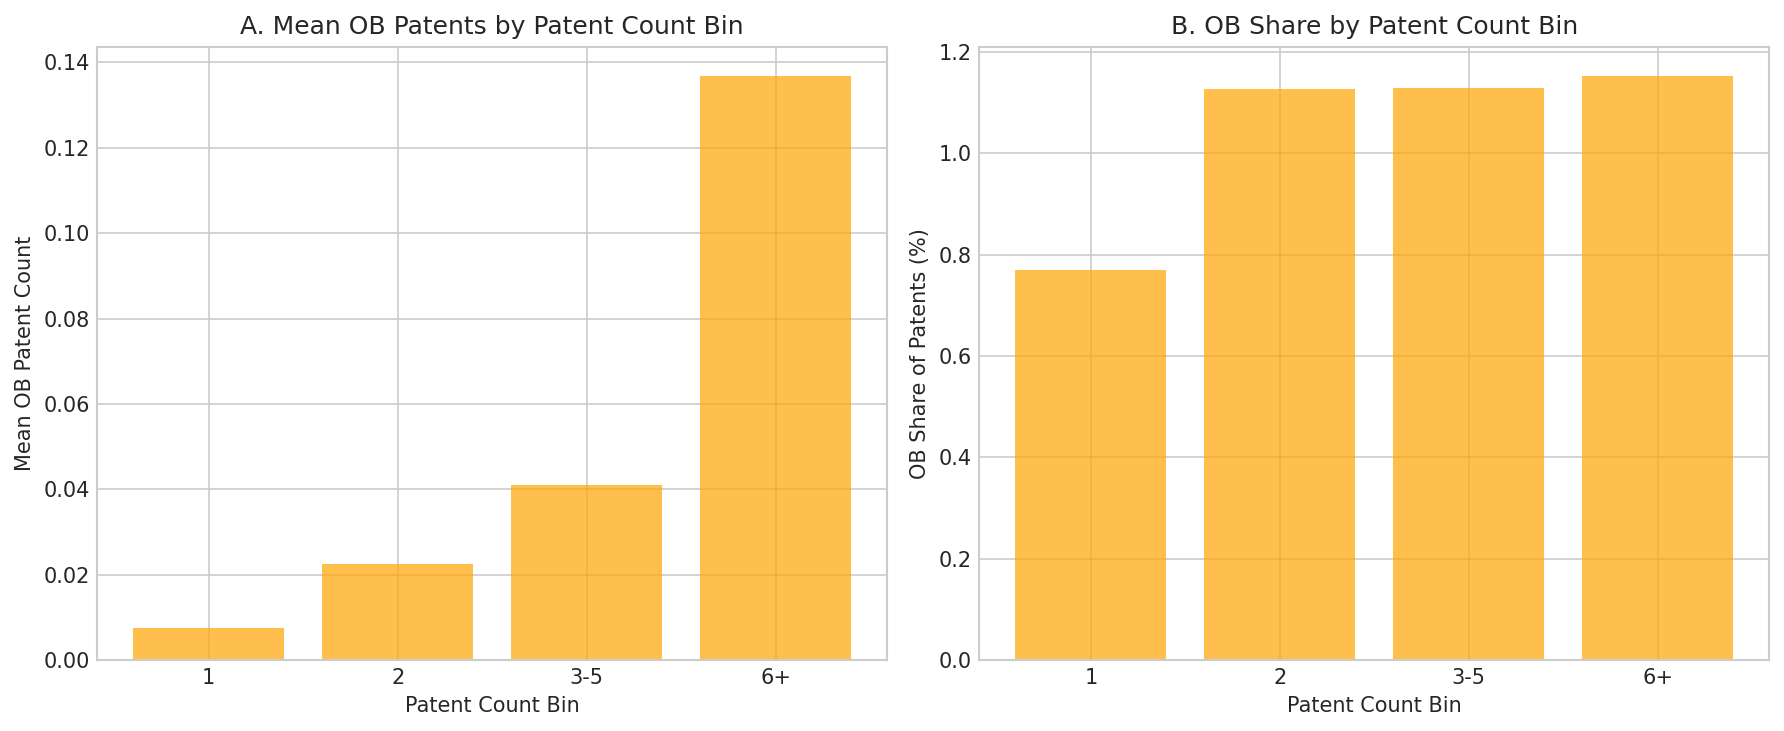
Figure 4: Orange Book patent intensity by total patent count bin. Cells with more patents (6+) have higher mean OB counts and slightly higher OB share (~1.15% vs 0.77% for single-patent cells).
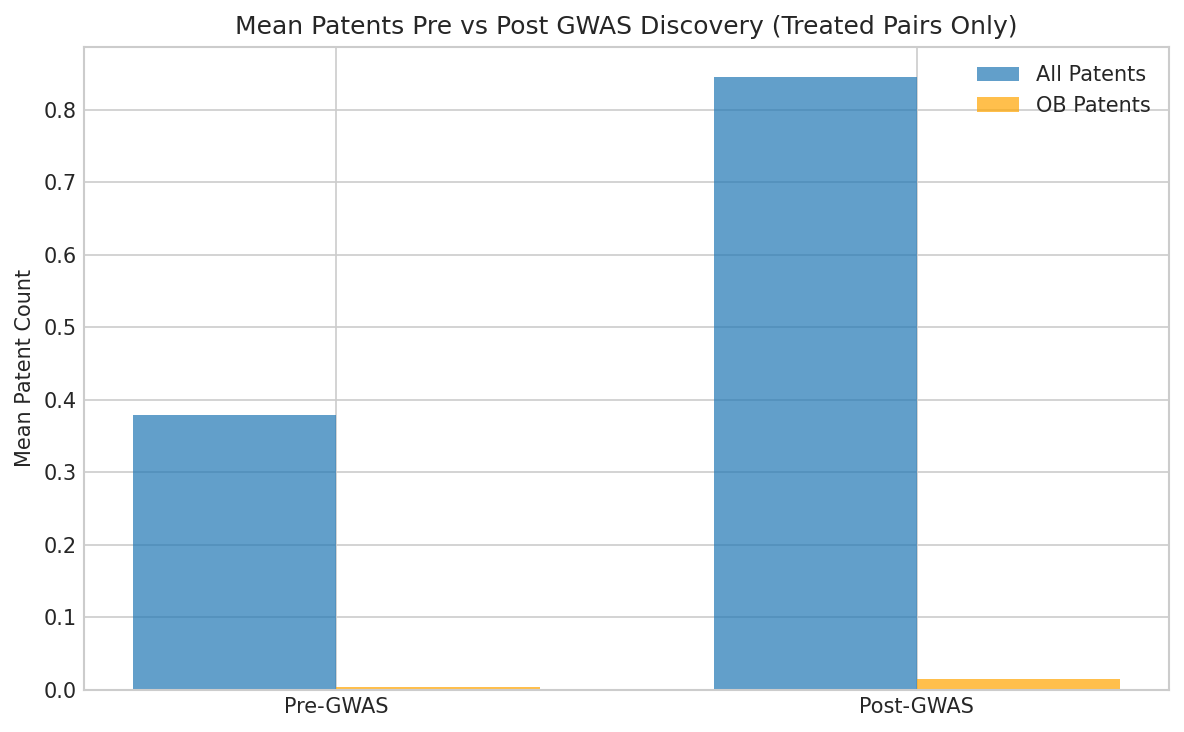
Figure 5: Mean patent counts before vs after GWAS discovery for treated gene-disease pairs. Both all patents (0.38 → 0.85) and OB patents (0.004 → 0.015) show ~2-4x increases post-GWAS.
Methodology
Orange Book patent IDs were downloaded from the FDA (January 2025) and matched against BioBERT-extracted patent-gene-disease associations. Patent counts were aggregated to the gene-disease-year level and merged with the GWAS spillover panel.
Stata Usage
reghdfe ob_patent_count post_gwas, absorb(gene_year disease_year) cluster(gene disease)

* For sparse counts, consider Poisson:
ppmlhdfe ob_patent_count post_gwas, absorb(gene_year disease_year) cluster(gene disease)