Medical Pathway Analyzer
Automated extraction of gene/protein interaction networks from 49k pathway diagrams using Gemini 3 Pro
Methodology
Prompt (v2)
You are an expert bioinformatician specializing in pathway analysis.
Extract gene/protein interaction networks from signaling pathway diagrams.

CRITICAL RULES:
1. Map genes to Human Entrez Gene IDs when possible
2. Protein families (Rho, GAP, MAPK) get entrez_id: null, is_family_representative: true
3. Phenotypes/outcomes (Cell scattering, APOPTOSIS, G1 Phase) get node_type: "phenotype"
4. Identify small molecules, drugs, inhibitors, or metabolites (e.g., 'PD98059', 'ATP', 'Calcium', 'Wortmannin') as node_type: "chemical". Do not exclude them. Do not assign Entrez IDs to chemicals.
5. Ensure biological processes (e.g., 'Cell Cycle', 'G1 Phase', 'Apoptosis') are strictly labeled as 'phenotype' to distinguish them from molecular entities.
6. Dashed lines or "?" marks → uncertain: true
7. Detect if the pathway diagram contains any question marks (?) and set has_question_marks accordingly
8. Identify the overall pathway/biological process shown in the diagram and provide a brief description
9. Identify the PRIMARY canonical pathway shown. Use standard names like: "PI3K-AKT signaling", "MAPK/ERK signaling", "Wnt/beta-catenin signaling", "NF-kB signaling", "TGF-beta signaling", "JAK-STAT signaling", "Notch signaling", "Hedgehog signaling", "p53 signaling", "Apoptosis", "Autophagy", "Cell cycle", "mTOR signaling", "AMPK signaling", "Hippo signaling", "TNF signaling", "Toll-like receptor signaling", "Insulin signaling", "VEGF signaling", "Calcium signaling", etc. If the pathway doesn't match a canonical name, provide the most descriptive name possible.
10. Output ONLY valid JSON with no extra text

Return this exact JSON structure:
{
  "figure_metadata": {
    "has_question_marks": boolean,
    "pathway_description": "string (1-2 sentence description)",
    "canonical_pathway": "string (primary pathway name, e.g. 'PI3K-AKT signaling')",
    "related_pathways": ["string (other pathways shown or connected)"]
  },
  "nodes": [
    {
      "label": "string",
      "node_type": "gene|phenotype|complex|chemical|other",
      "entrez_id": integer|null,
      "is_family_representative": boolean,
      "notes": "string"
    }
  ],
  "edges": [
    {
      "source": "string",
      "target": "string",
      "interaction": "activation|inhibition|binding|indirect",
      "uncertain": boolean
    }
  ]
}
Example JSON Output
{
  "figure_metadata": {
    "has_question_marks": false,
    "pathway_description": "A schematic of the cell cycle highlighting the G1 phase sub-stages (G1-pm and G1-ps). It illustrates a signaling network where ERK and YAP1 in the post-mitotic G1 phase activate PI3K and Beta-catenin in the pre-synthesis G1 phase to drive cell cycle progression.",
    "canonical_pathway": "Cell cycle",
    "related_pathways": ["MAPK/ERK signaling", "Hippo signaling", "PI3K-AKT signaling", "Wnt/beta-catenin signaling"]
  },
  "nodes": [
    {"label": "YAP1", "node_type": "gene", "entrez_id": 10413, "is_family_representative": false, "notes": ""},
    {"label": "ERK", "node_type": "gene", "entrez_id": null, "is_family_representative": true, "notes": "MAPK family"},
    {"label": "PI3K", "node_type": "complex", "entrez_id": null, "is_family_representative": true, "notes": ""},
    {"label": "beta-catenin", "node_type": "gene", "entrez_id": 1499, "is_family_representative": false, "notes": "CTNNB1"},
    {"label": "G0", "node_type": "phenotype", "entrez_id": null, "is_family_representative": false, "notes": "Quiescence"},
    {"label": "G1", "node_type": "phenotype", "entrez_id": null, "is_family_representative": false, "notes": "Gap 1 phase"}
  ],
  "edges": [
    {"source": "ERK", "target": "PI3K", "interaction": "activation", "uncertain": false},
    {"source": "YAP1", "target": "beta-catenin", "interaction": "activation", "uncertain": false},
    {"source": "ERK", "target": "beta-catenin", "interaction": "activation", "uncertain": true},
    {"source": "YAP1", "target": "PI3K", "interaction": "activation", "uncertain": true}
  ]
}
Processing Pipeline
Source: 49,014 pathway diagram images from PubMed Central papers stored in Dropbox
Model: Google Gemini 3 Pro Preview via Vertex AI
Throughput: ~120 images/minute with 200 concurrent requests using native async API
Resilience: Auto-resume on failure, 5x retry with exponential backoff, 120s timeout per request
Output: JSONL with nodes, edges, and metadata per image; exported to CSV (154 MB total)
Distributions
Node Types
Edge Types
7.8% of edges marked uncertain
Top 20 Canonical Pathways
Audit: Random Samples
5 randomly selected images from the 48,779 processed. Compare extracted networks against original diagrams.
PMC7823885 — Figure F3
Liver metabolic reprogramming and inflammatory signaling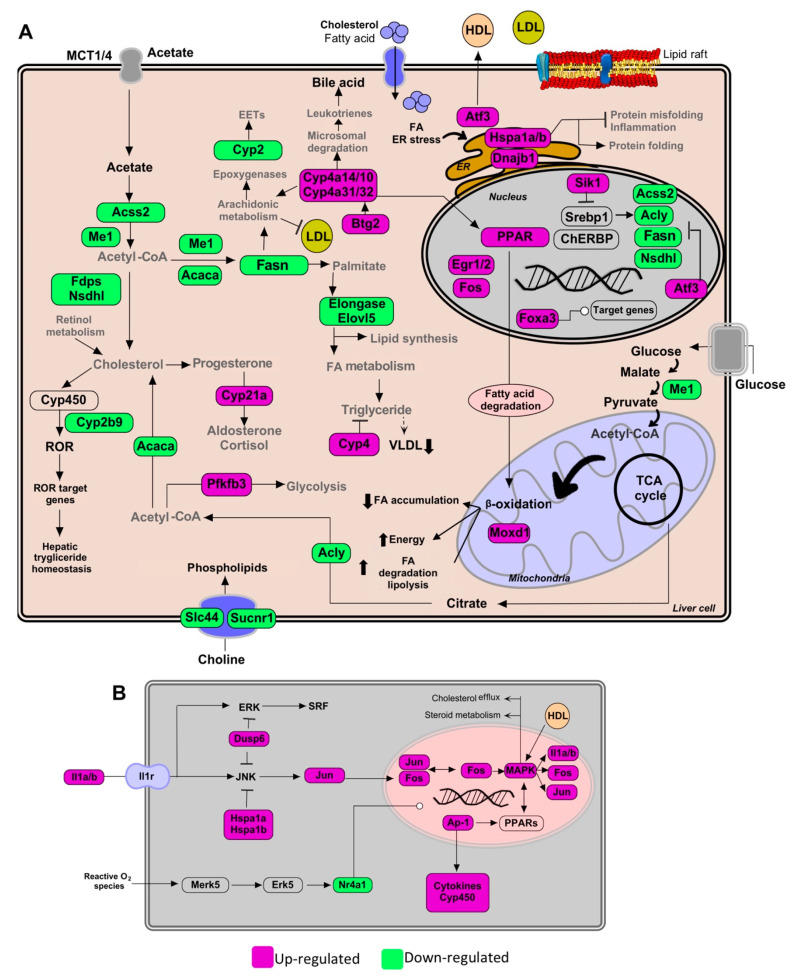
PMC7105607 — Figure F2
NF-kB signaling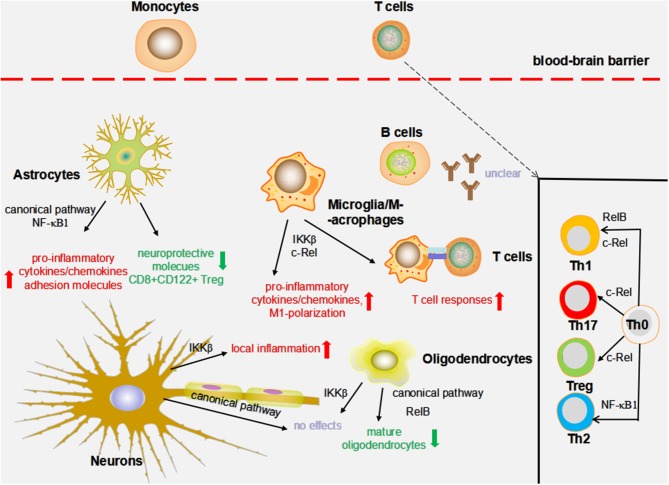
PMC4580081 — Figure F2
JAK-STAT signaling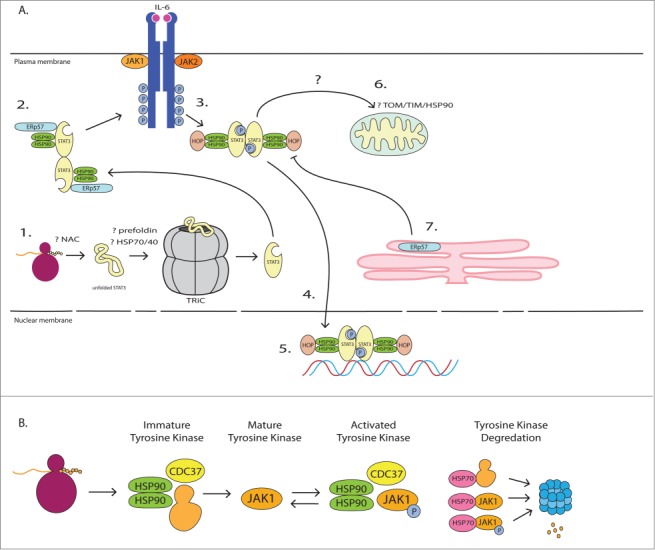
PMC7155770 — Figure F4
Necroptosis signaling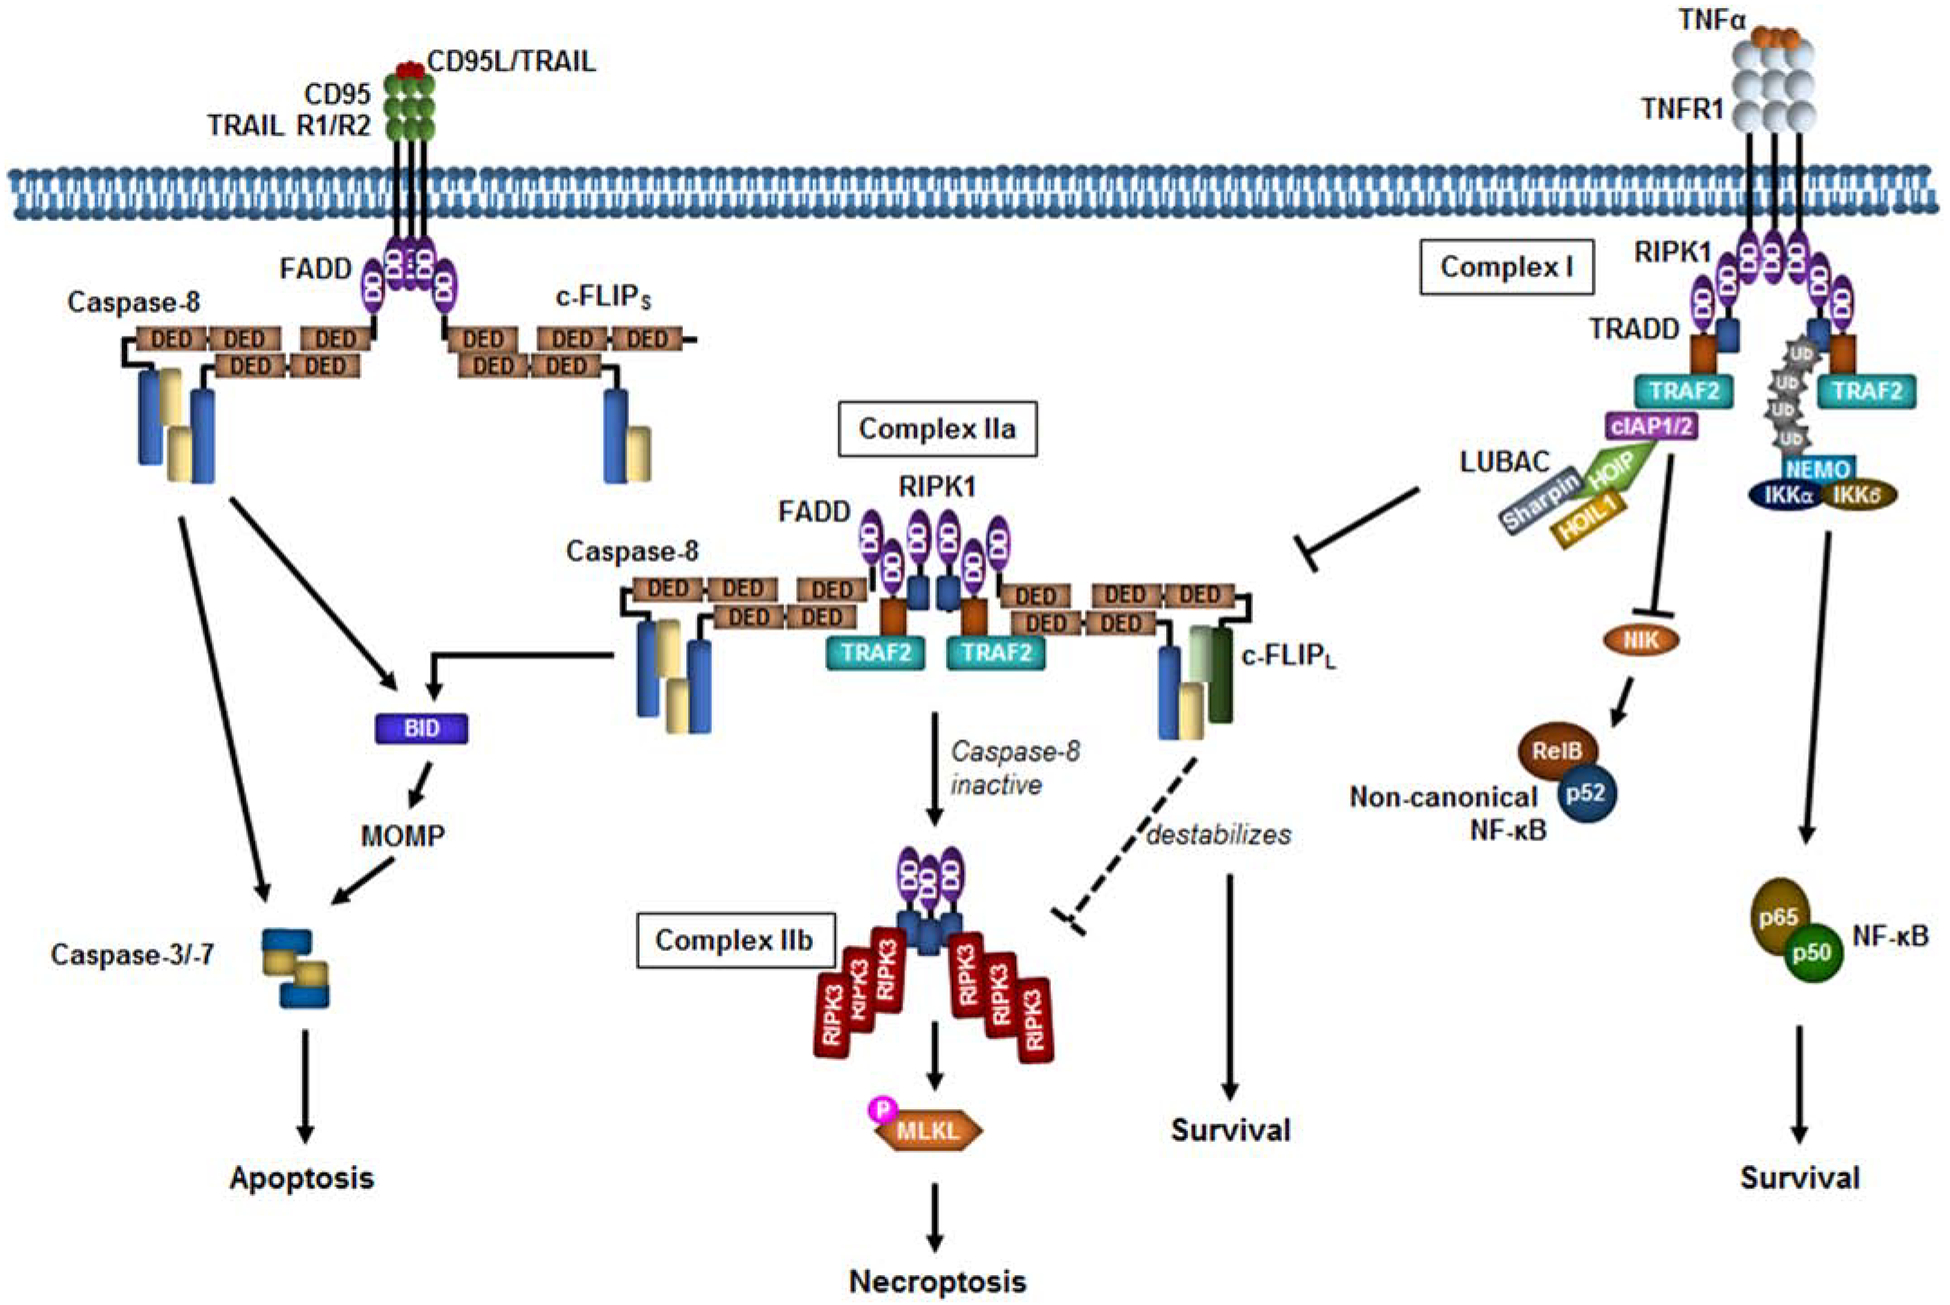
PMC5867880 — Figure F3
Regulation of Cell Migration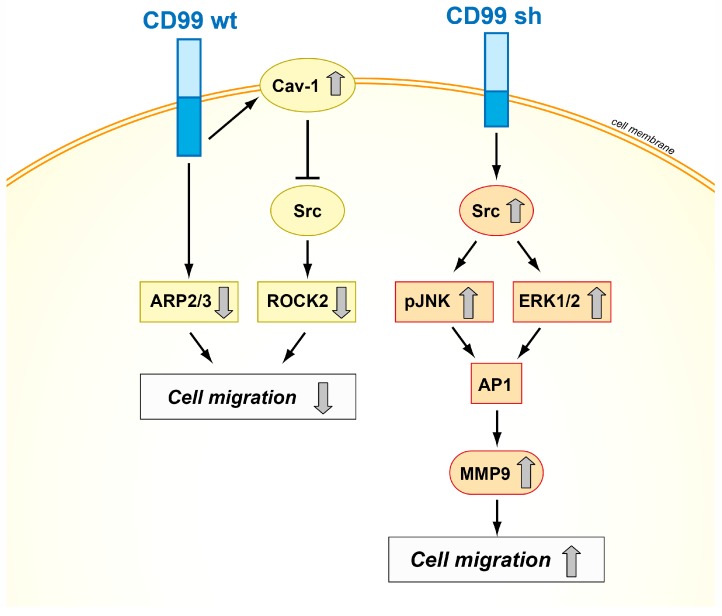
Audit: Same Pathway Comparison
5 images all labeled as Autophagy from different papers. These show biological consensus — different researchers independently agreeing on core pathway components.
Similarities & Differences
Consensus (Agreement)
- 10 core genes in all 5 papers
- ~50% average overlap (higher than Notch's 38%)
- ULK1 complex: ULK1, ATG13, FIP200, ATG101
- PI3K III complex: VPS34, VPS15, Beclin-1
- ATG conjugation: ATG3, ATG5, ATG7, ATG10, ATG12
Variation (Context-dependent)
- Regulatory focus: Some emphasize mTOR, others AMPK
- Phagophore → Autophagosome: "activation" vs "indirect"
- Unique genes: WIPI2 (PMC8888908), Bcl-2/Rab7 (PMC7272661)
- Naming variants: ATG16L vs ATG16L1 vs ATG16-1